
Measuring Visual Engagement Metrics for Online Car Listings

Visual engagement metrics for car listings measure what buyers actually do with your images: how many photos they view, how long they spend on the gallery, whether they open the 360° spin or video, whether they zoom, and how often gallery interaction is followed by an enquiry.
Key takeaways
- Count image views and gallery depth, not just page views.
- Interaction with a spin or video is a stronger intent signal than a scroll.
- The metric that matters is the one that correlates with enquiries on your own inventory.
- Compare listings with rich media against those without before drawing conclusions.
Why measure visual engagement?
Tracking visual engagement metrics allows dealerships to:
- Understand Buyer Behavior: See how users interact with your visuals and which features draw the most attention.
- Improve Listings: Identify areas to optimize, such as better angles, more close-ups, or higher-quality images.
- Boost Conversion Rates: Engaged viewers are more likely to make inquiries or schedule a test drive.
- Gain a Competitive Edge: Data-driven insights help you refine your listings and stand out in crowded marketplaces.
Which visual engagement metrics should you track?
What does click-through rate tell you?
- What It Measures: The percentage of viewers who click on a car listing after seeing its thumbnail.
- Why It Matters: A high CTR indicates that your thumbnail is visually compelling and grabs attention.
Tips to Improve CTR:
- Use high-quality, well-lit images for thumbnails.
- Add subtle overlays, such as “Certified Pre-Owned” or “$2,000 Off.”
- Ensure the background is clean and consistent.
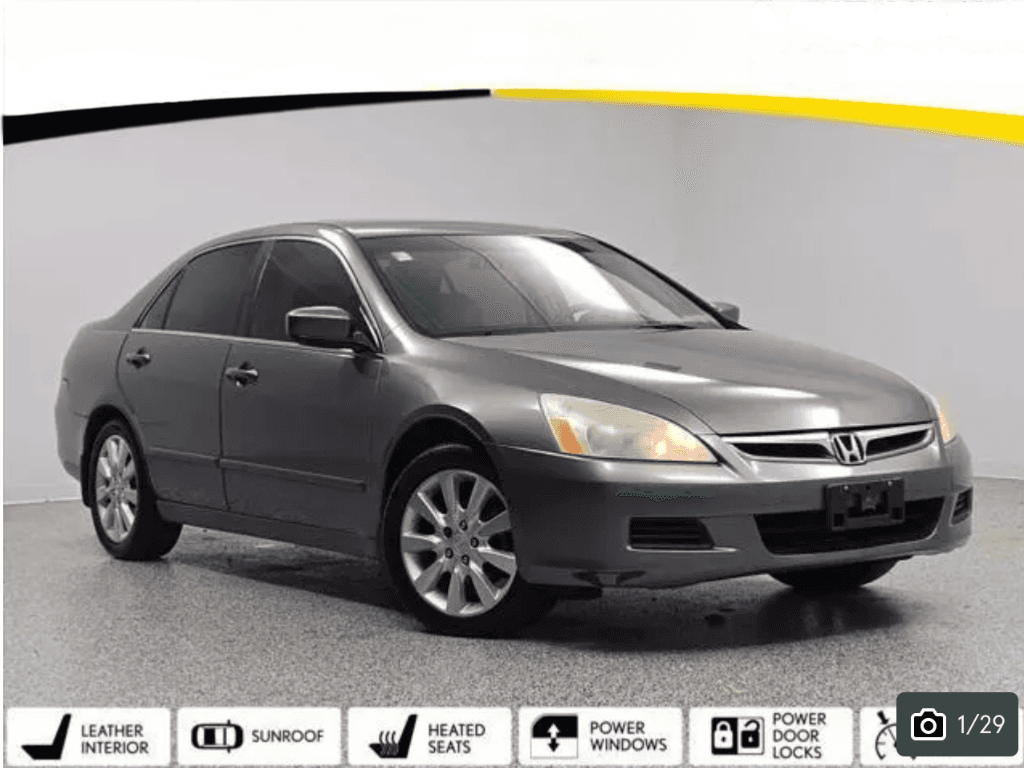
What does time spent on visuals mean?
- What It Measures: The average time users spend interacting with photos, videos, or 360° tours.
- Why It Matters: Longer interaction times show higher engagement, meaning users are interested in exploring the car in detail.
How to Increase Engagement Time:
- Include multiple angles, close-ups, and detailed shots of key features.
- Add interactive elements like zoom functionality or 360° spin views.
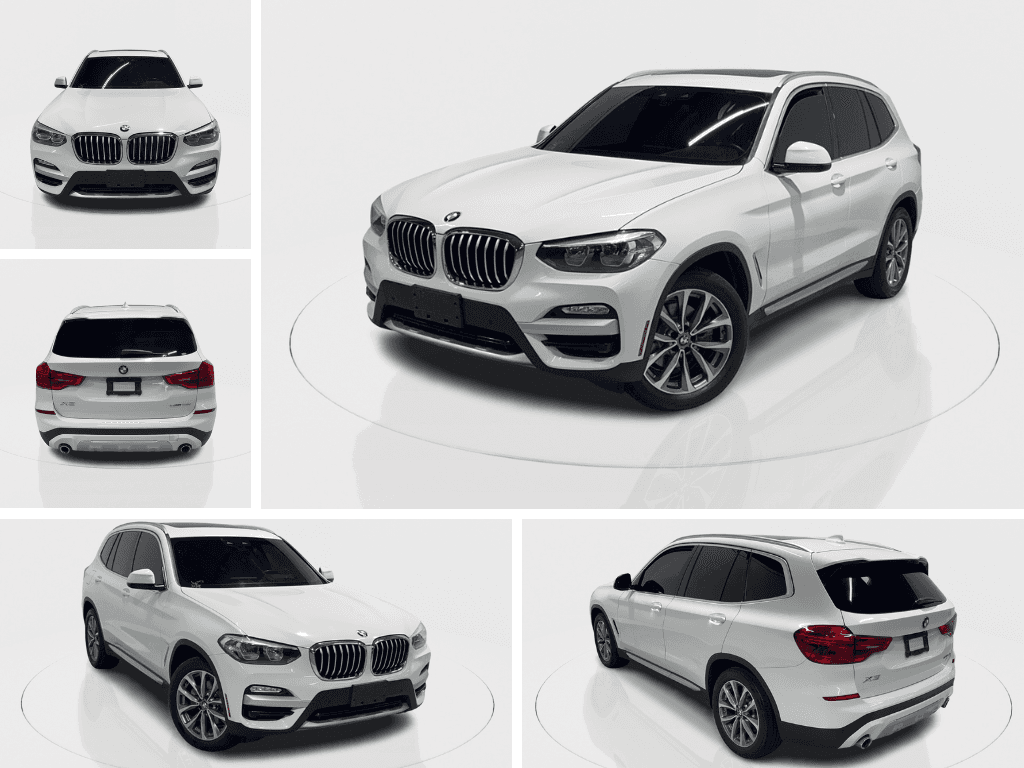
What is image swipe rate?
- What It Measures: The number of images users swipe through in a gallery.
- Why It Matters: This indicates how much interest users have in viewing the car’s different aspects.
Optimization Tips:
- Order images logically: Start with exterior shots, then move to interiors, close-ups, and special features.
- Avoid cluttered or repetitive photos.
How do you measure interaction with 360° and zoom?
- What It Measures: The percentage of users who interact with features like 360° spin views, zoom tools, or clickable hotspots.
- Why It Matters: Higher interaction rates suggest that users find these tools valuable and engaging.
Improving Interaction Rates:
- Highlight interactive features with tooltips or labels like “Rotate to View” or “Zoom In.”
- Ensure interactive visuals load quickly and function smoothly, especially on mobile devices.
What does scroll depth reveal about a listing?
- What It Measures: How far down the page users scroll while viewing the listing.
- Why It Matters: A deeper scroll depth shows that users are engaging with your visuals and other listing elements.
Tips to Improve Scroll Depth:
- Place high-quality visuals near the top of the page to capture attention immediately.
- Use engaging headings or CTAs to encourage further exploration.
What does a high bounce rate mean for a listing?
- What It Measures: The percentage of users who leave the page without interacting with any visuals or content.
- Why It Matters: A high bounce rate may indicate that your visuals are not engaging or that the page is loading too slowly.
Reducing Bounce Rates:
- Compress image files to improve page load speed.
- Use visually striking thumbnails to grab attention instantly.
- Ensure your listings are mobile-friendly.
How do you attribute conversions to visuals?
- What It Measures: The percentage of users who take action—such as scheduling a test drive or contacting the dealership—after engaging with visuals.
- Why It Matters: This is the ultimate indicator of how effectively your visuals are driving sales.
Boosting Visual Conversions:
- Include call-to-action buttons (e.g., “Book a Test Drive” or “Get More Details”) near interactive features.
- Ensure visuals are transparent and accurately represent the car’s condition to build trust.
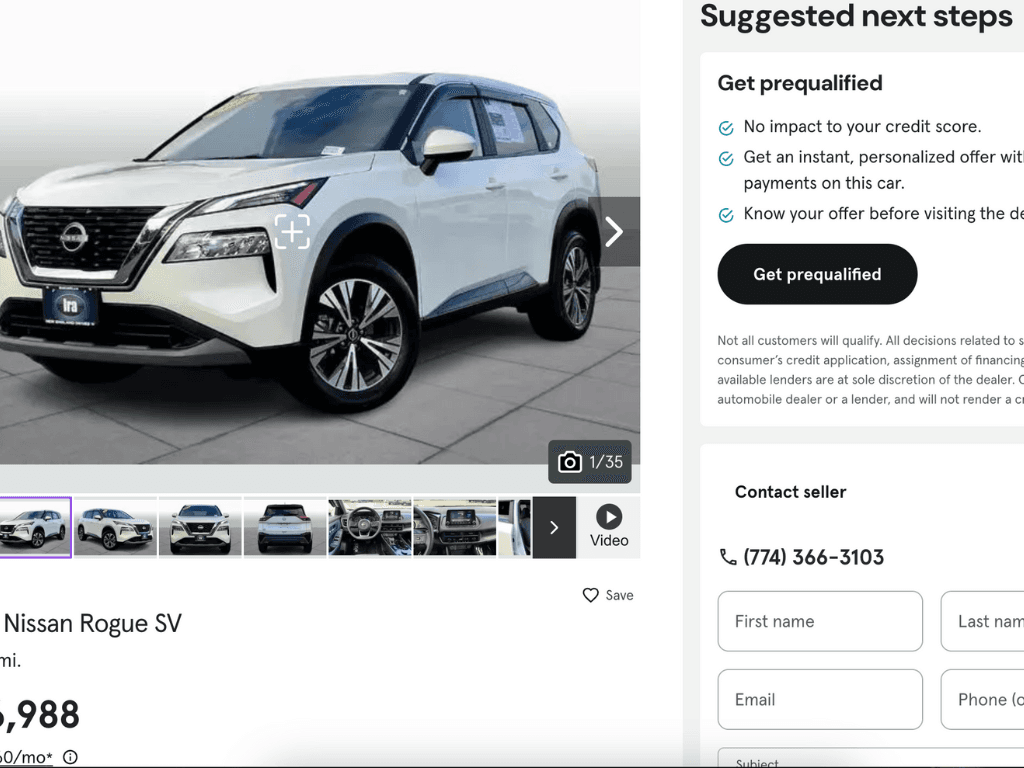
How do you track these metrics?
Tracking visual engagement metrics may require the use of tools and platforms that specialize in analytics for online listings:
- Google Analytics: Track bounce rates, session duration, and scroll depth.
- Heatmap Tools: Platforms like Hotjar or Crazy Egg show which parts of your visuals users interact with the most.
- HelloRamp.ai: Offers detailed insights into engagement with car visuals, including interaction rates for 360° tours, swipe galleries, and zoom features.
- Marketplace Insights: Platforms like Cars.com or Autotrader often provide built-in analytics to track listing performance.
What are the common challenges, and how do you overcome them?
- Slow Loading Times: Large image files can slow down your page, leading to higher bounce rates.
- Solution: Use image compression tools or HelloRamp.ai to optimize visuals without losing quality.
- Unengaging Thumbnails: Poorly designed thumbnails fail to grab attention.
- Solution: Focus on clean backgrounds, sharp angles, and appealing overlays.
- Mobile Compatibility Issues: Many users browse listings on their phones, so visuals must perform well on smaller screens.
- Solution: Use responsive designs and test your visuals across devices.
Conclusion
Measuring visual engagement metrics is essential for understanding how buyers interact with your car listings. By tracking key metrics like click-through rates, time spent on visuals, and interaction rates, dealerships can refine their listings to capture more attention and drive higher conversions.
Frequently asked questions
Which visual engagement metrics should dealerships track?
Images viewed per listing, gallery depth before drop-off, time spent in the gallery, 360° spin and video open rate, zoom interactions, and the enquiry rate of listings with rich media against those without.
How do you track image engagement on car listings?
Through event tracking in your analytics platform on gallery opens, image advances, spin and video plays and zoom actions, and through whatever reporting your media provider exposes.
What is a good number of photos for a car listing?
Enough to cover the full exterior sequence, the cabin and every detail a buyer would inspect, including flaws. Track where buyers drop off in your gallery and let that set the number.
Does adding a 360 spin increase enquiries?
Test it on your own inventory. Run listings with and without the spin over the same period and compare enquiry rates, rather than assuming a figure from another market.
HelloRamp.ai is AI visual merchandising for car dealerships: guided capture, daily social publishing and personalised video replies to leads, in one platform. Book a walkthrough using your own vehicles.